 Translate
1. Purpose
The Council is required by regulations issued under the Local Government in Scotland Act 2003 and the Chartered Institute of Public Finance and Accountancy’s Treasury Management in the Public Services: Code of Practice 2021 Edition (the CIPFA Code) to approve a Treasury Management Strategy before the start of each financial year. The Council is also required by regulation to have regard to CIPFA’s Prudential Code for Capital Finance in Local Authorities (2021) under Part 7 of the Local Government in Scotland Act 2003.
In addition, the Consent by Scottish Ministers for the Investment of Money by Scottish Local Authorities, which came into force in April 2010, requires the Authority to approve an Investment Strategy before the start of each financial year.
This strategy meets these requirements fully.
Three main reports on Treasury Management activity are presented to Members each year, incorporating a variety of policies, estimates and actuals. These are:
- Annual Treasury Management and Investment Strategy (this report), which is submitted to full Council before the start of each financial year.
- Mid-Year Treasury Management and Investment Report, submitted to Cabinet as soon as possible following 30 September each year.
- Annual Treasury Management and Investment Report, submitted to full Council annually by the 30 June following the end of each financial year.
Responsibilities
Regulations place responsibility on Members for the review and scrutiny of treasury management policy and activities. The following Scheme of Delegation has been adopted by the Council:
Full Council
- to receive and review reports on treasury management policies, practices and activities;
- to approve the annual Treasury Management and Investment Strategy.
Cabinet
- to approve amendments to the treasury management policy statement and treasury management practices;
- to approve the division of responsibilities;
- to receive and review regular monitoring reports and act on recommendations.
Section 95 Officer
The Council’s Section 95 Officer is responsible for the proper administration of the Council’s financial affairs and is required:
- to recommend treasury management policies/practices, review these regularly and monitor compliance;
- to submit regular treasury management updates;
- to receive and review management information;
- to review the performance of the treasury management function;
- to ensure the adequacy of treasury management resources and skills and the effective division of responsibilities within the treasury management function; and
- to approve the appointment of external service providers.
External Treasury Advisers
The Council recognises that there is value in employing external providers of treasury management services, in order to access specialist skills and resources.
However, it recognises that the responsibility for treasury management decisions remains with the Council at all times and officers will ensure that undue reliance is not placed upon external advice.
The Council’s current external treasury management advisors are Arlingclose Limited. The contract started on 5 April 2021 and is due to expire on 4 April 2026. A current tender exercise is underway and will be awarded to the successful bidder from 5 April 2026. The Council will ensure that the terms of their appointment and the methods by which their value is assessed are properly agreed, documented and subject to regular review.
2. Executive Summary
The treasury management function ensures that the Council’s funds are managed in accordance with the relevant professional codes, so that sufficient cash is available to meet service activity. This involves both the organisation of the cash flow and, where capital plans require, the organisation of appropriate borrowing facilities.
CIPFA defines treasury management as:
Quote: The management of the organisation’s borrowing, investments and cash flows, including its banking, money market and capital market transactions; the effective control of the risks associated with those activities; and the pursuit of optimum performance consistent with those risks.
Quote from: Chartered Institute of Public Finance and Accountancy
This document outlines the Council’s Annual Treasury Management Strategy and Annual Investment Strategy providing:
- a summary of the Council’s capital plans;
- an outline of the treasury management strategy in relation to borrowing and the impact of capital plans on this borrowing; and
- an outline of the investment strategy including the type of instruments available for investment and our permitted counterparties.
Key prudential and treasury indicators
Key prudential and treasury indicators are provided throughout this strategy which clearly articulate the operational parameters in relation to Treasury Management and Investment, as well as providing assurances in relation to the affordability and sustainability of capital investment plans. Tables 1a, 1b and 1c contain the key prudential and treasury indicators within the report.
| Prudential and Treasury Indicators | 2025/2026 Probable Outturn | 2026/2027 Estimate | 2027/2028 Estimate | 2028/2029 Estimate |
|---|---|---|---|---|
| General Services | £88.766 million | £142.123 million | £73.394 million | £40.290 million |
| HRA | £44.558 million | £70.103 million | £84.367 million | £62.879 million |
| Total | £133.324 million | £212.226 million | £157.761 million | £103.169 million |
| Prudential and Treasury Indicators | 2025/2026 Probable Outturn | 2026/2027 Estimate | 2027/2028 Estimate | 2028/2029 Estimate |
|---|---|---|---|---|
| General Services | £370.740 million | £470.500 million | £505.862 million | £513.984 million |
| HRA | £214.956 million | £256.479 million | £309.575 million | £343.422 million |
| Total | £585.696 million | £726.979 million | £815.437 million | £857.406 million |
| Prudential and Treasury Indicators | 2025/2026 Probable Outturn | 2026/2027 Estimate | 2027/2028 Estimate | 2028/2029 Estimate |
|---|---|---|---|---|
| Gross Borrowing | £530.392 million | £683.675 million | £772.133 million | £814.102 million |
| Operational Boundary for Borrowing | £608.036 million | £740.741 million | £829.870 million | £868.463 million |
| Authorised limit for Borrowing | £668.840 million | £814.815 million | £912.857 million | £955.309 million |
| Total Operational Boundary (Including PPP/NPD) | £686.626 million | £814.458 million | £897.893 million | £931.010 million |
| Total Authorised Limit (Including PPP/NPD) | £747.430 million | £888.532 million | £980.880 million | £1,017.856 million |
| Liability Benchmark | £485.610 million | £641.737 million | £744.564 million | £786.881 million |
| Investments | £30.000 million | £30.000 million | £30.000 million | £30.000 million |
A summary of this is provided as follows, with more detailed information provided in the body of the report.
Capital Expenditure for the General Fund (GF) reflects the capital investment programme for 2026/2027 to 2033/2034 and Housing Revenue Account (HRA) reflects the capital investment programme for 2026/2027 and the capital investment plans included in the latest business plan. To ensure the financial consequences of the new programme are fully transparent, all relevant indicators have been projected to 2033/2034 and these can be found in Appendix 1.
The Capital Financing Requirement (CFR) is the underlying borrowing requirements of the Council.
Gross Borrowing reflects the actual borrowing which has been undertaken. This is projected to be lower than the CFR as the Council continues with its strategy to use internal funds.
The Operational Boundary is the maximum borrowing and other long-term liabilities to fund previous years’ and the current year capital programme, building in flexibility for the timing of the different funding streams and principal repayments. The operational boundary includes any other long-term liabilities (e.g. PPP/NPD schemes, finance leases) however no borrowing is actually required against these schemes as a borrowing facility is included in the contract.
The Authorised Limits is set at 10% above the Operational Boundary to give some flexibility around raising funds for future year capital investment.
The Liability Benchmark is an estimate of the cumulative amount of external borrowing the Council must hold to fund its current capital and revenue plans while keeping treasury investments at the minimum level required to manage day-to-day cash flow.
Affordability of borrowing is measured by the percentage of financial costs relative to the net revenue stream of the GF and HRA.
The average investment rate estimated for 2026/2027 is 3.25% and is reflective of the Council’s appetite for risk, the short term nature of investments and the permitted instruments and counterparties selected.
Other prudential and treasury indicators and supporting information can be found in the main body of this report.
Client status
The second Market in Financial Instruments Directive (MiFID II), introduced in January 2018, classifies Local Authorities as “retail clients” unless they choose to opt-up to “professional client” status. This has the advantages of lower fees and access to a greater range of products and investment firms. The Council continues to opt-up to professional client status. In order to meet the professional client criteria, the Council must hold a £10m investment portfolio at all times and have at least one officer with the necessary level of experience and knowledge to understand the risks involved in the management of the investments.
3. Capital and Prudential Indicators 2026/2027 to 2028/2029
In exercising its power to borrow, the Local Authority (Capital Finance and Accounting) (Scotland) Regulations 2016 require the Authority to have regard to the Chartered Institute of Public Finance and Accountancy’s Prudential Code for Capital Finance in Local Authorities (the Prudential Code). The Prudential Code is a framework to ensure Councils demonstrate effective control over levels of, and decisions relating to, capital investment activity, including borrowing. The Treasury indicators are used to ensure that risk is managed and controlled effectively. Together the Prudential and Treasury Indicators consider the affordability and impact of capital expenditure decisions and set out the Council’s overall capital framework.
Capital Expenditure and Financing
This prudential indicator is a summary of the Council’s capital expenditure plans, both those agreed previously and those forming part of the 2026/2027 budget setting.
The 2025/2026 budget proposes an updated Capital Investment Programme for General Services to 2033/2034 and updated investment plans for the HRA for 2026/2027 and the capital investment plans included in the latest business plan. All projects within the Capital Programme are linked to the Council’s key strategic priorities. These are also covered in the Capital Investment Strategy, produced in line with the requirements of the Prudential Code. To ensure that the financial consequences of the new programme are fully transparent, all relevant indicators have been projected to 2033/2034 and these can be found in Appendix 1. Table 2 shows the capital expenditure plans and how they are being financed by capital or revenue resources over the next three years. The borrowing figure in Table 2 is the difference between the estimates for total capital expenditure and the other funding sources.
| Estimates of Capital Expenditure and Income | 2025/2026 Probable Outturn | 2026/2027 Estimate | 2027/2028 Estimate | 2028/2029 Estimate |
|---|---|---|---|---|
| General Services Capital Expenditure | £88.766 million | £142.123 million | £73.394 million | £40.290 million |
| Funded by Borrowing | £56.990 million | £102.174 million | £38.601 million | £11.681 million |
| Funded by Receipts/Grants | £31.589 million | £39.949 million | £34.793 million | £28.609 million |
| Funded from Revenue | £0.187 million | 0 | 0 | 0 |
| Funded from Reserves | 0 | 0 | 0 | 0 |
| Total | £88.766 million | £142.123 million | £73.394 million | £40.290 million |
| HRA Capital Expenditure | £44.558 million | £70.103 million | £84.367 million | £62.879 million |
| Funded by Borrowing | £24.571 million | £48.869 million | £59.218 million | £40.474 million |
| Funded by Receipts/Grants | £10.196 million | £12.872 million | £15.888 million | £16.087 million |
| Funded from Revenue | £8.349 million | £5.580 million | £5.284 million | £5.447 million |
| Funded from Reserves | £1.442 million | £2.782 million | £3.977 million | £0.871 million |
| Total | £44.558 million | £70.103 million | £84.367 million | £62.879 million |
The Council’s overall borrowing need (the Capital Financing Requirement)
This indicator outlines the Council’s Capital Financing Requirement (CFR). The CFR is simply the total historic outstanding capital expenditure which has not been paid from either a capital or a revenue resource and, therefore, needs to be funded from borrowing. It is essentially a measure of the Council’s underlying borrowing need.
Part of the Council’s treasury activity is to meet the funding requirements for this borrowing need. The treasury management section organises the Council’s cash position to ensure that sufficient cash is available to meet the capital plans and cash flow requirements. This may be sourced through borrowing from external bodies (such as the Government, through the Public Works Loan Board [PWLB], or the money markets), or utilising temporary cash resources within the Council.
The Council’s underlying borrowing need (CFR) is not allowed to rise indefinitely. The Council is required to make an annual revenue charge, called the Loans Fund Principal Repayment. This is effectively a repayment of the borrowing need and it is charged to revenue over the life of the asset. This charge reduces the CFR each year. This differs from the treasury management arrangements, which ensure that cash is available to meet the payment of capital commitments on an ongoing basis. External debt can also be borrowed or repaid at any time, but this does not change the CFR.
The total CFR can also be reduced by:
- the application of additional capital financing resources (such as unapplied capital receipts); or
- increasing the annual revenue charge.
The Council’s CFR is shown below and is a key prudential indicator. The opening balances include the PPP/NPD schemes on the balance sheet, which increase the Council’s borrowing need. This is shown to give a complete picture of the Council’s debt. However, no borrowing is actually required against these schemes as a borrowing facility is included in the contract and, as such, this is subtracted from the total CFR to identify the Loans CFR. The Loans CFR is forecast to rise over the next few years as capital expenditure financed by borrowing increases.
| Capital Financing Requirement (CFR) | 2025/2026 Probable Outturn | 2026/2027 Estimate | 2027/2028 Estimate | 2028/2029 Estimate |
|---|---|---|---|---|
| General Services | £449.330 million | £544.217 million | £573.885 million | £576.531 million |
| HRA | £214.956 million | £256.479 million | £309.575 million | £343.422 million |
| Sub-total | £664.286 million | £800.696 million | £883.460 million | £919.953 million |
| Less PPP/NPD long-term liability | £(78.590) million | £(73.717) million | £(68.023) million | £(62.547) million |
| Loans CFR | £585.696 million | £726.979 million | £815.437 million | £857.406 million |
| Movement in CFR | 2026/2027 Estimate | 2027/2028 Estimate | 2028/2029 Estimate |
|---|---|---|---|
| General Services | £99.760 million | £35.362 million | £8.122 million |
| HRA | £41.523 million | £53.096 million | £33.847 million |
| Annual Change | £141.283 million | £88.458 million | £41.969 million |
Liability benchmark
The liability benchmark, which is now a treasury prudential indicator, is an important tool to help establish whether the Council is likely to be a long-term borrower or long-term investor in the future, and so shape its strategic focus and decision making. The liability benchmark itself represents an estimate of the cumulative amount of external borrowing the Council must hold to fund its current capital and revenue plans while keeping treasury investments at the minimum level required to manage day-to-day cash flow.
| Liability Benchmark | 2024/2025Actual | 2025/2026Estimate | 2026/2027Forecast | 2027/2028Forecast | 2028/2029 Forecast |
|---|---|---|---|---|---|
| Loans CFR | £513.672 million | £585.696 million | £726.979 million | £815.437 million | £857.406 million |
| Less Balance sheet resources | £(157.921) million | £(110.086) million | £(95.242) million | £(80.873) million | £(80.525) million |
| Net loans requirement | £355.751 million | £475.610 million | £631.737 million | £734.564 million | £776.881 million |
| Liquidity allowance | £10.000 million | £10.000 million | £10.000 million | £10.000 million | £10.000 million |
| Liability Benchmark | £365.751 million | £485.610 million | £641.737 million | £744.564 million | £786.881 million |
Following on from the medium-term forecasts in the table above, the long-term liability benchmark assumes capital expenditure funded by borrowing will be in line with the 10 year capital plan and 30 year HRA business plan respectively, loans fund advances on new capital expenditure based on asset life and income, expenditure and reserves all increasing by inflation of 2.5% a year with any specific adjustments made for planned use of reserves. This is shown in the chart below together with the maturity profile of the Council’s existing borrowing:
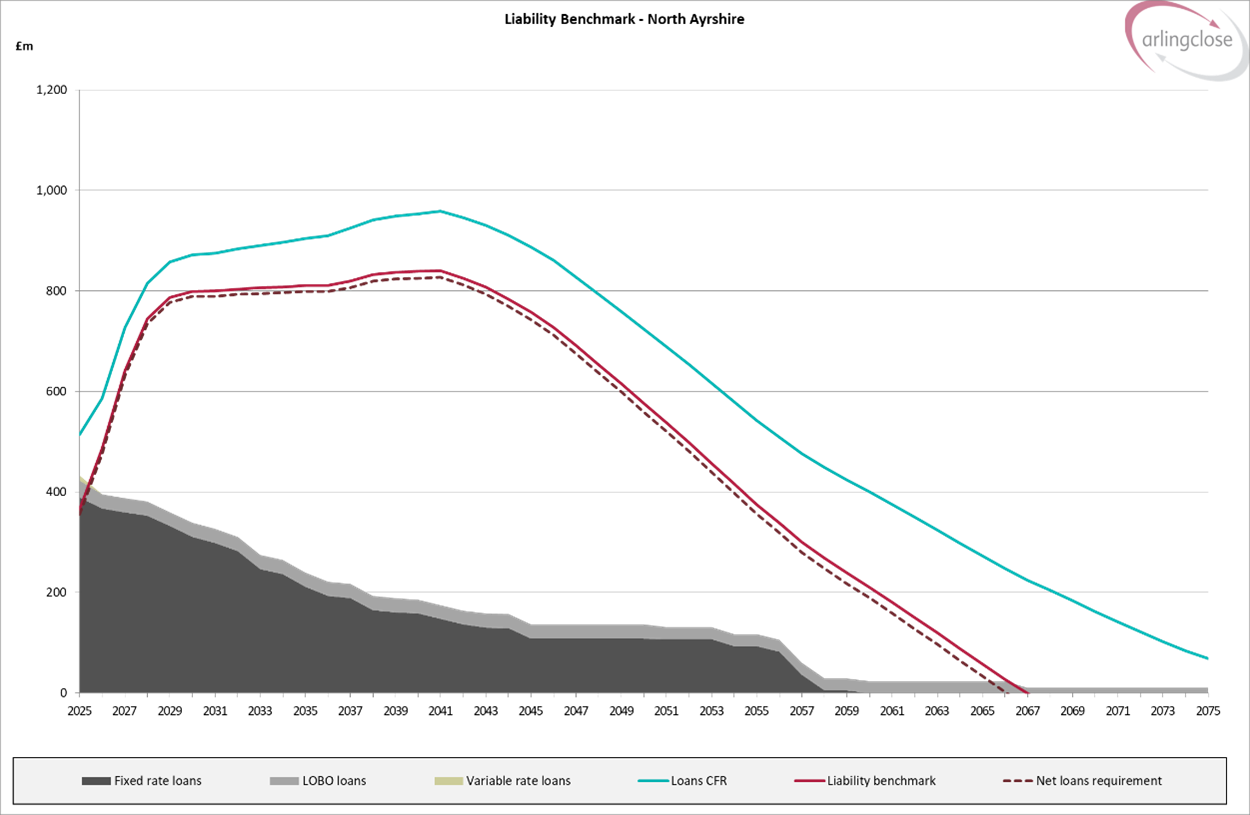
The Liability benchmark graph above is used to inform the Council’s borrowing strategy. The shaded grey area shows the Councils current debt and the gap between this and the Liability benchmark line is how much more borrowing the Council likely needs to undertake to support its current capital plans once taking into account its balance sheet resources. The above graph indicates that long term borrowing for the period of up to 25 years would be most appropriate to meet the Councils borrowing needs and mitigate against interest rate risk.
Limits to borrowing activity
The Operational Boundary
The operational boundary is the expected maximum borrowing position of the Council during the year, taking account of the timing of various funding streams and the recharge of principal repayments from the revenue account. Periods where the actual position varies from the boundary are acceptable, subject to the authorised limit not being breached.
The Authorised Limit
The authorised limit represents a limit beyond which external debt is prohibited. This limit is set by Council and can only be revised by Council approval. It reflects the level of external borrowing which, while not desirable, could be afforded in the short term, but is not sustainable in the longer. The current limit is set at 10% above the Operational Boundary.
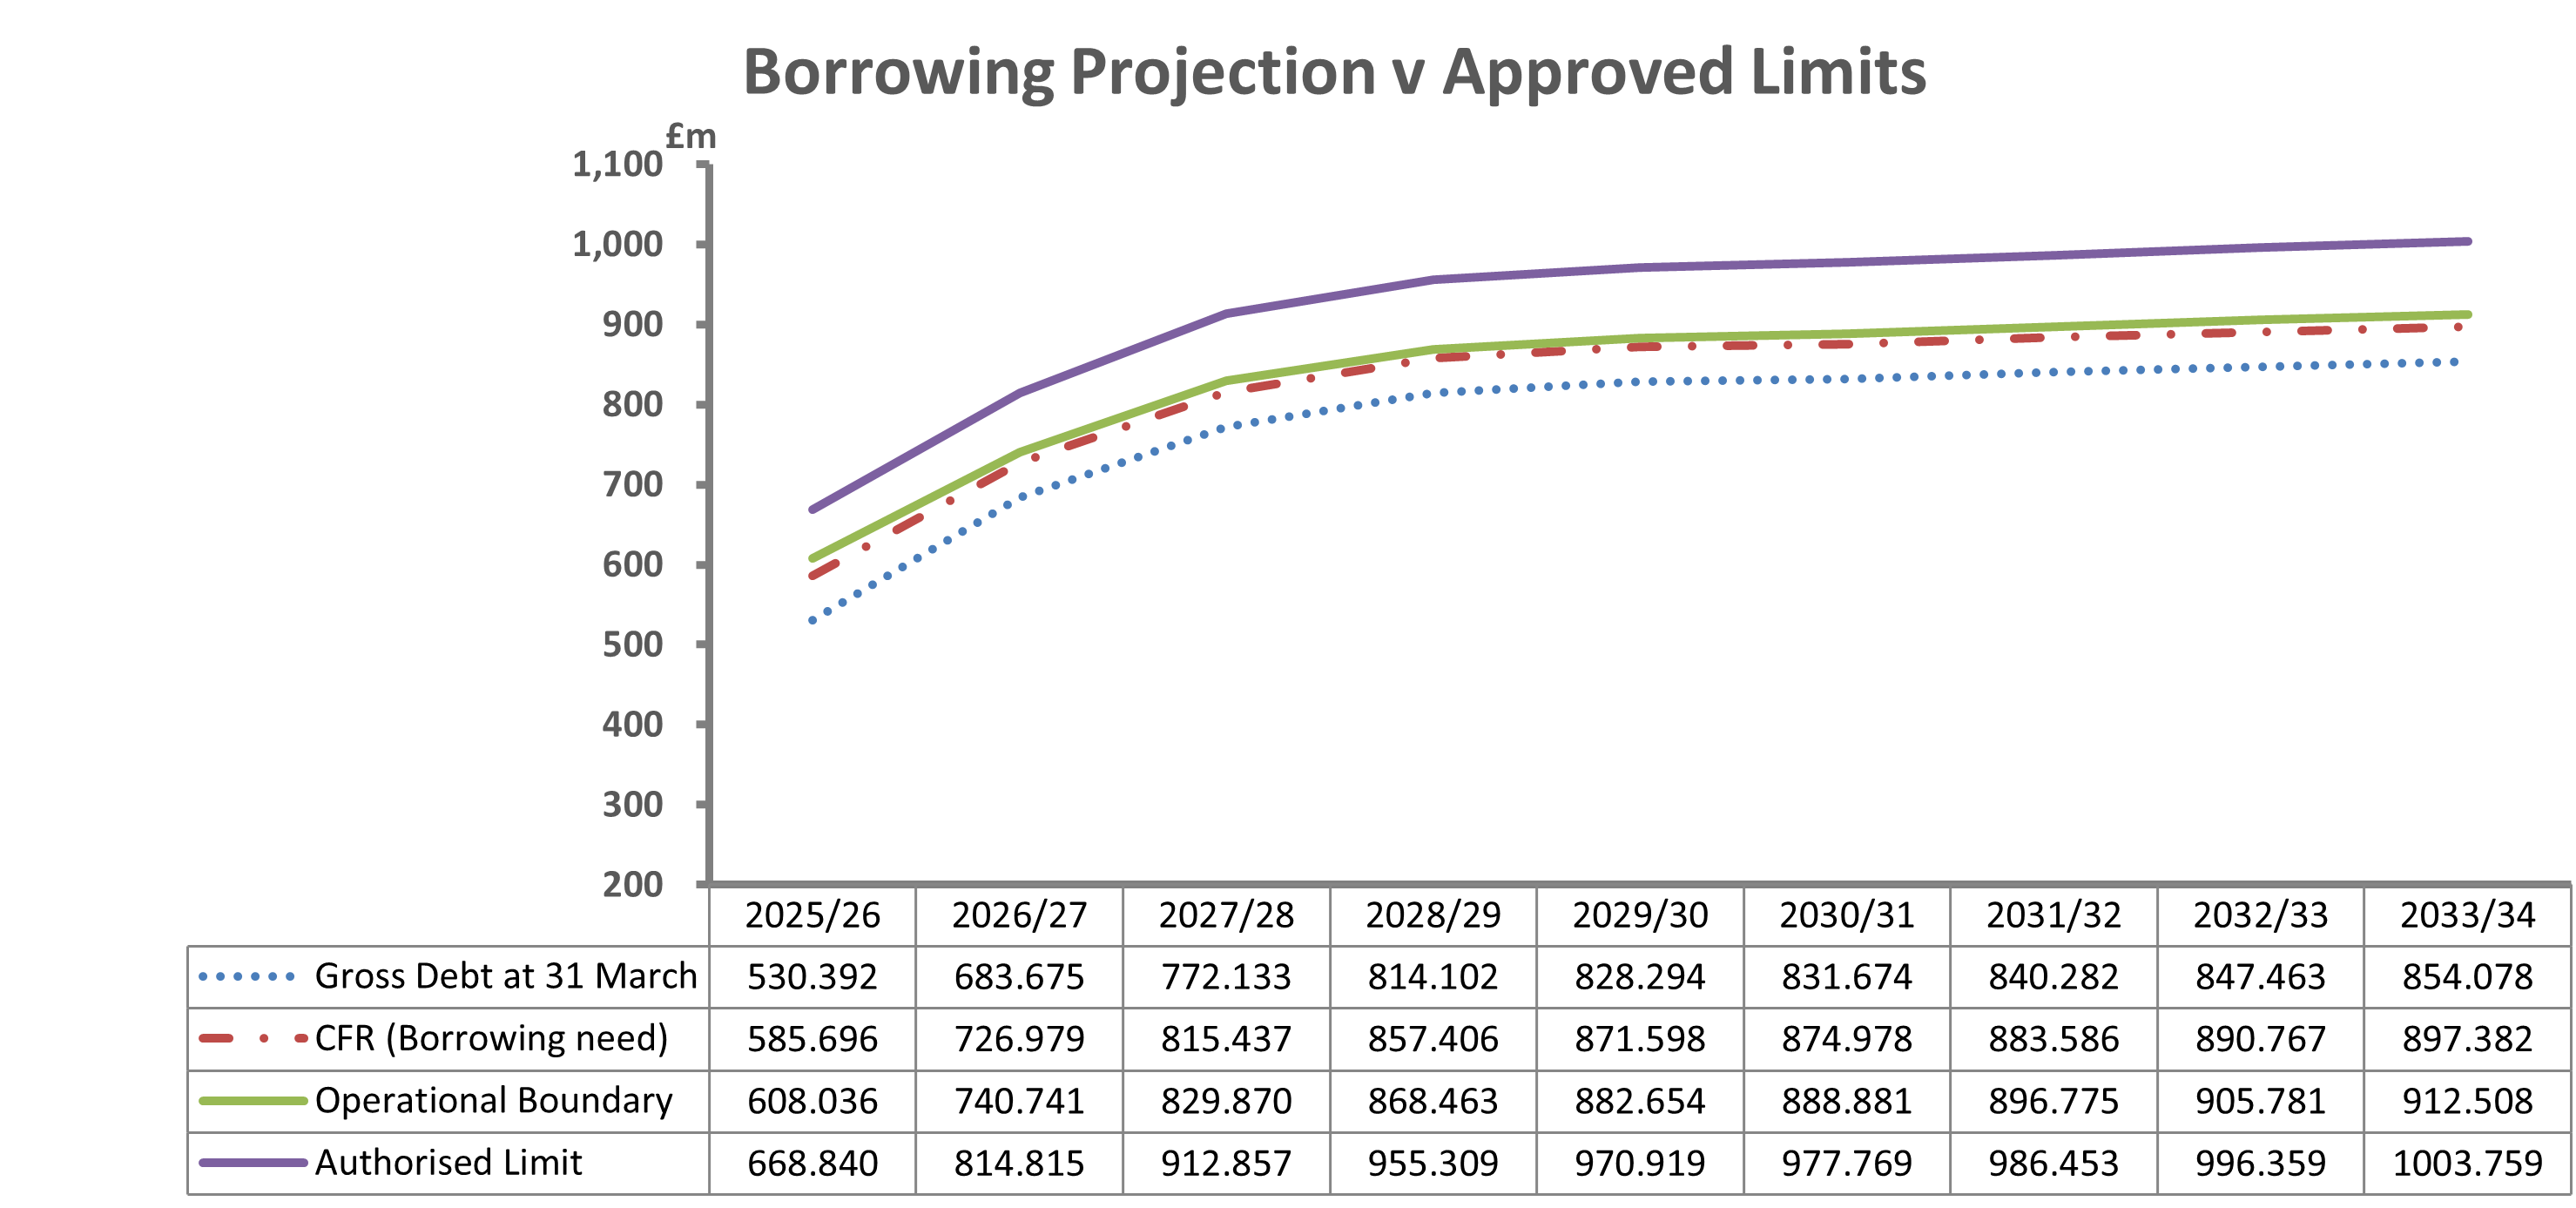
The following graph shows the projected levels of the Operational Boundary and Authorised Limit for Borrowing, compared with the Council’s CFR and gross debt position. CIPFA’s Prudential Code for Capital Finance in Local Authorities recommends that the Council’s total debt should not exceed the highest forecast CFR over the next three years. This provides Councils with some flexibility to borrow to meet future capital investment requirements but provides a balance to ensure debt is not held for long periods of time without an underlying need to fund capital investment. The graph below confirms that the Council expects to comply with this recommendation.
Affordability Prudential Indicators
These Prudential Indicators assess the affordability of capital investment plans and provide an indication of the impact of capital investment plans on the Council’s overall finances. The cost impact of borrowing decisions are reflected in the Council’s budget as loan charges. These have been projected to 2033/2034 in line with the capital plan.
Actual and estimates of the proportion of financing costs to net revenue stream
This indicator identifies the trend in the cost of capital (borrowing and other long-term liabilities net of investment income) against the net revenue stream and reflects the profile of the loans fund advances together with future capital investment. The estimates of financing costs include current commitments and those arising from the capital programme. The HRA costs are aligned with the 30-year business plan.
| Proportion of financing costs to net revenue stream | 2025/2026 Probable Outturn | 2026/2027 Estimate | 2027/2028 Estimate | 2028/2029 Estimate |
|---|---|---|---|---|
| General Services | 3.7% | 4.6% | 5.4% | 5.8% |
| HRA | 26.3% | 31.5% | 33.8% | 34.7% |
Capital expenditure impacts on the revenue budget through financing charges, so it is essential that the Council ensures the financing costs remain affordable and do not constitute an excessive proportion of the revenue resources available. From a General Fund perspective, the CIPFA Directors of Finance Performance Indicators 2024/2025 show a Scottish Local Authority average of 6.0%, therefore demonstrating a prudent borrowing policy. For the HRA, the indicative Scottish average in 2024/2025 was 20.1%. The ratio within the HRA is indicative of the significant capital investment programme as outlined in the Strategic Housing Investment Plan. The level of loan charges is deemed prudent and affordable within the framework of the 30 year Housing business plan.
4. Treasury Management Strategy
The treasury management function ensures that the Council’s funds are managed in accordance with the relevant professional codes, so that sufficient cash is available to meet service activity. This involves both the organisation of the cash flow and, where capital plans require, the organisation of appropriate borrowing facilities. The strategy covers the relevant treasury/prudential indicators, the current and projected debt positions and the annual investment strategy. The primary objectives of the Council’s borrowing strategy is to minimise the revenue impact of borrowing and to effectively manage the repayment profile of the debt.
The treasury strategy aligns with the Council Plan by contributing to “maximising financial flexibilities to help support delivery of priorities” and “Maximising value from the use of our assets” as referred to under the priority of “A Sustainable Council”.
Economic outlook
Interest rate forecast
Interest rate forecasts are key to forecasting the costs of future borrowing. The Council’s treasury management adviser Arlingclose is forecasting that the bank rate will decline during 2026 before settling at 3.25%. The projected rates are shown in the following graph alongside an assessment of PWLB borrowing rates to December 2028:

Current portfolio position
The Council’s projected treasury portfolio position at 31 March 2026, with future year estimates, is summarised below. Table 6 shows the probable outturn of gross debt at 31 March 2026, and the estimated gross debt 2026/2027 to 2028/2029, against the underlying capital borrowing need (the CFR) highlighting any over or under borrowing. Both the external debt and CFR exclude the Council’s liabilities in respect of the PPP/NPD schemes.
| Current Portfolio Position (excluding PPP/NPD) | 2025/2026 Probable Outturn | 2026/2027 Estimate | 2027/2028 Estimate | 2028/2029 Estimate |
|---|---|---|---|---|
| Gross Debt at 31 March | £530.392 million | £683.675 million | £772.133 million | £814.102 million |
| CFR | £585.696 million | £726.979 million | £815.437 million | £857.406 million |
| (Under)/Over borrowed position | £(55.304) million | £(43.304) million | £(43.304) million | £(43.304) million |
Within the prudential indicators there are a number of key indicators to ensure that the Council operates within well-defined limits. One of these is that the Council’s gross debt should not, except in the short term, exceed the total of the CFR. This allows some flexibility for limited early borrowing for future years but ensures that borrowing is not undertaken for revenue purposes.
The Council’s borrowing strategy continues to address the key issue of affordability without compromising the longer-term stability of the debt portfolio. The Council is currently under-borrowed. This means that the capital financing requirement (CFR), has not been fully funded with loan debt because the cash supporting the Council’s internal balances and cash flow is being used as a temporary measure.
Against this background and the risks within the economic forecast, caution will be adopted within 2026/2027 treasury operations. The Section 95 Officer will monitor interest rates and adopt a pragmatic approach to changing circumstances. For example:
- if it is anticipated that there is a significant risk of a sharp fall in long and short-term rates, then long-term borrowings will be postponed and potential rescheduling from fixed rate funding into short-term borrowing will be considered.
- if it is anticipated that there is a significant risk of a sharp rise in long and short-term rates than that currently forecast, then the portfolio position will be re-appraised with the likely action that fixed rate funding will be drawn whilst interest rates are still lower than they are expected to be in the next few years.
Any such decisions will be reported to the Cabinet as part of the mid-year and annual treasury outturn report. A summary of treasury risks and mitigating controls can be found at Appendix 2.
Controls on borrowing activity
The purpose of these controls is to manage the risk and impact of any adverse movement in interest rates. However, if they are set to be too restrictive, they may impair opportunities to reduce costs/improve performance. The indicators are:
- Upper limits on variable interest rate exposure. This identifies a maximum limit for variable interest rates based upon the debt position net of investments;
- Upper limits on fixed interest rate exposure. This is similar to the previous indicator and covers a maximum limit on fixed interest rates.
| Limits | 2025/2026probable outturn | 2025/2026 limit | 2026/2027 limit | 2027/2028 limit | 2028/2029 limit |
|---|---|---|---|---|---|
| Limits on fixed interest rates based on net debt | £502.042 million | £668.840 million | £814.815 million | £912.857 million | £955.309 million |
| Limits on variable interest rates based on net debt | £28.350 million | £60.000 million | £60.000 million | £60.000 million | £60.000 million |
Maturity structure of borrowing. These gross limits are set to reduce the Council’s exposure to large sums falling due for refinancing; both upper and lower limits are required.
| Maturity profile of borrowing | 2025/2026 probable outturn | 2025/2026 probable outturn | Lower limit % | Upper limit % |
|---|---|---|---|---|
| under 12 months | £29.945 million | 7% | 0% | 50% |
| 12 months and within 24 months | £7.622 million | 2% | 0% | 50% |
| 24 months and within 5 years | £49.071 million | 12% | 0% | 50% |
| 5 years and within 10 years | £98.343 million | 24% | 0% | 75% |
| 10 years and above | £221.847 million | 55% | 25% | 90% |
| Total borrowing | £406.827 million | 100% | Not applicable | Not applicable |
The impact of a 1% rise in interest rates based on the Councils current debt portfolio is shown in the table below:
| Interest rate risk exposure | 2026/2027 | 2027/2028 | 2028/2029 |
|---|---|---|---|
| Impact of 1% increase in interest rates | £0.130 million | £0.273 million | £0.348 million |
| Impact of 1% decrease in interest rates | £(0.011) million | £(0.087) million | £(0.170) million |
LOBOs
The Council currently holds £29.500m of Lender’s Option Borrower’s Option (LOBO) loans where the lender has the option to propose an increase in the interest rate at set dates, following which the Council has the option to either accept the new rate or to repay the loan at no additional cost. Similar to other debt held by the Council we continue to work with treasury management advisers to identify financially beneficial opportunities to repay LOBO loans.
Policy on borrowing in advance of need
The Council will not borrow more than, or in advance of, its needs purely to profit from the investment of the extra sum borrowed. Any decision to borrow in advance will be within forward approved CFR estimates and will be considered carefully to ensure that value for money can be demonstrated and that the Council can ensure the security of such funds.
Risks associated with any advance borrowing activity will be subject to appraisal and subsequent reporting in either the mid-year or annual treasury report.
Debt rescheduling
As short-term borrowing rates are cheaper than longer term fixed interest rates, there may be potential opportunities to generate savings by switching from long-term to short-term debt. However, these savings will need to be considered in the light of the current treasury position and the cost of any premiums incurred on early debt repayment.
Potential reasons for debt rescheduling include:
- the generation of cash savings and/or discounted cash flow savings; or
- the enhancement of the portfolio balance (amend the maturity profile and/or risk).
The recent rise in interest rates means that more favourable debt rescheduling opportunities should arise than in previous years. All debt rescheduling proposals will be reported to Cabinet/full Council as part of the annual or mid-year report.
Borrowing sources
Approved sources of long-term and short-term borrowing are:
- HM Treasury’s PWLB lending facility (formerly the Public Works Loan Board) and any successor body;
- National Wealth Fund Ltd (formerly UK Infrastructure Bank Ltd)
- Any institution approved for investments (see Appendix 3);
- Any other bank or building society authorised to operate in the UK;
- Any other UK public sector body;
- UK public and private sector pension fund (except Strathclyde Pension Fund);
- Capital market bond investors; or
- Other special purpose companies created to enable local authority bond issues.
In addition, capital finance can be raised by the following methods that are not borrowing, but are classed as other debt liabilities:
- Leases;
- Hire purchase;
- Private Finance Initiatives (including PPP/NPD);
- Sale and leaseback arrangements; or
- Similar asset based finance
Alternatives to PWLB
North Ayrshire Council has previously raised the majority of its long-term borrowing from the PWLB but will consider long-term loans from other sources including banks, pensions and local authorities. The Council will also investigate the possibility of issuing bonds and similar instruments, which may offer lower interest costs and reduce over-reliance on one source of funding in line with the CIPFA Code. An example of this is where organisations issue bonds on the capital markets and lend the proceeds to local authorities. As these will represent a more complex form of borrowing, any decision to borrow in this way will be the subject of a separate report to Council.
PWLB loans are no longer available to local authorities planning to buy investment assets primarily for yield. The Council therefore intends to avoid this activity in order to retain its access to PWLB loans.
Policy on use of financial derivatives
A financial derivative is a contract, which derives its value from the performance of an underlying entity. They are used for a number of purposes, including insuring against price movements. In the absence of any explicit legal power to do so, the Council will not use standalone financial derivatives (such as swaps, forwards, future and options). Derivatives embedded into loans and investments, including pooled funds and forward starting transactions, may be used and the risks that they present will be managed in line with the overall treasury risk management strategy.
Policy on repayment of Loans Fund Advances
The prudent repayment of Loans Fund Advances are made under the provisions of The Local Authority (Capital Finance and Accounting) (Scotland) Regulations 2016, which came into force on 1 April 2016.
These Regulations require North Ayrshire Council to outline its policy on the repayment of loans fund advances. The loans fund advance is effectively the repayment of the ‘principal’ linked to the capital expenditure which is funded from borrowing.
The statutory guidance identifies a number of options for the prudent repayment of advances, including basing the repayments on:
- the depreciation charges made against the assets;
- the life of the assets, using either the annuity or equal instalments methodology; or
- the funding or income streams attached to the assets.
For the majority of projects undertaken by the Council, the policy is to repay loans fund advances linked to asset life using the annuity methodology. However, where appropriate, the repayment of advances arising from projects with associated income streams will be matched to the profile of the income.
The Council will continue to consider the most appropriate repayment methods, which align to the benefits of the assets and ensure a prudent repayment, for existing and future advances.
The policy is outlined in full in Appendix 4.
5. Investment strategy
The Council’s investment strategy has regard to the Local Government Investment (Scotland) Regulations (and accompanying finance circular) and the 2021 revised CIPFA Treasury Management in Public Services Code of Practice and Cross Sectoral Guidance Notes (“the CIPFA TM Code”). The Council’s objective when investing money is to strike an appropriate balance between risk and return, minimising the risk of incurring losses from defaults or of receiving unsuitably low investment income. The Council aims to be a responsible investor and will consider environmental, social and governance (ESG) issues when investing.
The aim of the Investment Strategy is to provide security of investment and minimisation of risk by generating a list of high creditworthy counterparties which will enable diversification. Investment instruments identified for use in the financial year, along with their associated risks and controls can be found in Appendix 3.
Counterparty limits are set through the Council’s Treasury Management Practices. The maximum that will be lent to any one organisation (other than the UK Government) will be £10 million. A group of banks under the same ownership, will be treated as a single organisation for limit purposes.
The Council uses purpose-built cash flow forecasting software to determine the maximum period for which funds may prudently be committed. The forecast is compiled on a prudent basis to minimise the risk of the Council being forced to borrow on unfavourable terms to meet its financial commitments. Limits on long-term investments are set by reference to the Council’s revenue budget and cash flow forecast.
Given the risk of bail-in (as defined on page 19) and continued low returns from short-term unsecured bank investments, the Council will take opportunities, as cash flows permit, to further diversify into more secure asset classes during 2026/2027. This diversification will mitigate further risks associated with investments.
Current portfolio position
| Current portfolio position | 2025/2026probable outturn | 2026/2027 estimate | 2027/2028 estimate | 2028/2029 estimate |
|---|---|---|---|---|
| Investments at 31 March | £30.000 million | £30.000 million | £30.000 million | £30.000 million |
| Net debt at 31 March | £500.392 million | £653.675 million | £742.133 million | £784.102 million |
Environmental, Social and Governance (ESG) Policy
Environmental, social and governance (ESG) considerations are increasingly a factor in global investors’ decision making, but the framework for evaluating investment opportunities is still developing and therefore the Council’s ESG policy does not currently include ESG scoring or other real-time ESG criteria at an individual investment level. When investing in banks and funds, the Council will prioritise banks that are signatories to the UN Principles for Responsible Banking and funds operated by managers that are signatories to the UN Principles for Responsible Investment, the Net Zero Asset Managers Alliance and/or the UK Stewardship Code. A list of ESG Initiative signatories is updated quarterly by the Council’s treasury advisor Arlingclose to support the Council’s decision making process for investing.
Creditworthiness policy
In accordance with the above, and in order to minimise risk, the Council has clearly stipulated the minimum acceptable credit quality of counterparties for inclusion on its lending list. The Council uses Arlingclose’s Approved Counterparties List which takes full account of the ratings, outlooks and watches published by all three ratings agencies. Ratings are monitored on a real time basis with any changes notified electronically supplemented by weekly update.
Investment decisions are made by reference to the lowest published long-term credit rating and analysis from the Council’s treasury management advisers. The Council considers high credit quality organisations and investments as those having a credit rating of A- or higher and which are domiciled in the UK or in a foreign country with a sovereign rating of AA+ or higher. For money market funds that are more diversified, “high credit quality” is defined as those having a credit rating of A- or higher. However, in addition to credit ratings, the Council will consider investments in organisations based on independent analysis from our treasury management advisors.
All credit ratings are monitored by the Treasury Team who are alerted to changes in ratings of the main rating agencies through Arlingclose’s weekly updates and following credit developments. Where a downgrade results in the counterparty or investment scheme no longer meeting the Council’s minimum criteria, any investment will be withdrawn immediately, where breakage costs are not excessive.
When deteriorating financial market conditions affect the creditworthiness of all organisations, as happened in 2008, 2020 and 2022, this is not generally reflected in credit ratings, but can be seen in other market measures. In these circumstances, the Council will restrict its investments to those organisations of higher credit quality and reduce the maximum duration of its investments to maintain the required level of security. The extent of these restrictions will be in line with prevailing financial market conditions. If these restrictions mean that insufficient commercial organisations of high credit quality are available to invest the Council’s cash balances, then the surplus will be deposited with the UK Government, or with other local authorities. This will cause investment returns to fall but will protect the principal sum invested.
The Council recognises that credit ratings are good, but not comprehensive, indicators of investment default. Full regard is therefore given to other available information on the credit quality of the organisations in which it invests including credit default swap prices, financial statements, information on government support, reports in the financial press and analysis from the Council’s treasury management adviser. No investment will be made with an organisation if there are substantive doubts about its credit quality, even though it may otherwise meet the above criteria.
Bail-in risk
Since the financial crisis, global authorities have embarked on a wide ranging review of the banking sector to ensure that the cost to the public purse of any future crises is contained. One of the most significant changes has arisen from the Financial Services (Banking Reform) Act 2013 which added the bail-in of certain unsecured creditors to the Special Resolution Regime (SRR) granted to the Bank of England under the Banking Act 2009. Bail-in is the opposite of bail-out and requires the country’s banking authority to bail-in funds from existing investments if a bank requires it to remain financially sustainable.
Local authority deposits in banks are unsecured and because other previously unsecured creditors such as retail investors have become preferred under UK and EU Directives, it means that the risks associated with local authority unsecured investments in banks have risen.
The best solution to mitigating against bail-in risk is to invest with high quality and credit worthy institutions. The identification of these institutions remains a key objective of the investment strategy. Ensuring diversification of investment counterparties is also an effective risk management approach and is reflected in investment counterparty limits.
Investment Strategy and Permitted Investments
The Investment Regulations (Code on the Investment of Money by Local Authorities) require the Council to approve all types of investments to be used and to set appropriate limits for the amount that can be held in each investment type. In determining its permitted investments, the Council must identify the treasury risks associated with each type of instrument and the controls put in place to limit risk on each investment type. Full details can be found in Appendix 3.
Investment returns expectations
The Bank Rate is forecast to gradually fall during 2026. Bank Rate forecasts for financial year ends (March) are:
- 2025/2026, 3.50%
- 2026/2027, 3.25%
- 2027/2028, 3.25%
The estimated rates for returns on investments placed for periods up to 100 days during each financial year for the next three years are as follows:
- 2025/2026, 3.50%
- 2026/2027, 3.25%
- 2027/2028, 3.25%
Investment Treasury Indicator and Limit
This is a control on the total principal funds invested for greater than 1 year. This limit is set with regard to the Council’s liquidity requirements and to reduce the need for early sale of an investment, and is based on the availability of funds after each year-end.
| Maximum principal sums invested for more than one year | 2025/2026 probable outturn | 2026/2027 limit | 2027/2028 limit | 2028/2029 limit |
|---|---|---|---|---|
| Principal sums invested for more than one year | £5.000 million | £10.000 million | £10.000 million | £10.000 million |
For cash flow management, the Council will seek to utilise its 15 and 30 day notice accounts, money market funds and short-dated deposits (overnight to three months) in order to benefit from the compounding of interest.
Summary of Material Investments, Guarantees and Liabilities
In line with the requirements in respect of the Council’s Capital Investment Strategy information is provided on material Investments, Guarantees and Liabilities. Reporting of this fits better within the TMIS. Information is provided in the table below:
The Council has the current historic investments on the balance sheet as at 31 March 2025:
| Category | Value as at 31 March 2025 |
|---|---|
| Long-term Debtors | £0.044 million |
| Total | £0.044 million |
The long-term debtors represent loan finance provided by the Council to other parties which relates to Advances for House Purchases.
Monitoring of Investment Strategy
An update on the investment position of the Council will be reported to Cabinet in the 2026/2027 Mid-Year Treasury report and the Annual Treasury Report will be submitted to the Council after the end of the financial year.
Appendix 1: Prudential Indicators 2029 to 2034
| Estimates of Capital Expenditure and Income | 2029 to 2030 Estimate | 2030 to 2031 Estimate | 2031 to 2032 Estimate | 2032 to 2033 Estimate | 2033 to 2034 Estimate |
|---|---|---|---|---|---|
| General services capital expenditure | £27.363 million | £10.510 million | £10.087 million | £10.087 million | £10.062 million |
| Funded by borrowing | £2.075 million | £0.615 million | £0.192 million | £0.192 million | £0.167 million |
| Funded by receipts/grants | £25.288 million | £9.895 million | £9.895 million | £9.895 million | £9.710 million |
| Funded from revenue | 0 | 0 | 0 | 0 | 0 |
| Funded from reserves | 0 | 0 | 0 | 0 | 0 |
| Total | £27.363 million | £10.510 million | £10.087 million | £10.087 million | £9.877 million |
| HRA capital expenditure | £35.943 million | £24.003 million | £31.863 million | £32.584 million | £33.590 million |
| Funded by borrowing | £21.831 million | £15.035 million | £21.605 million | £22.003 million | £21.389 million |
| Funded by receipts/grants | £5.621 million | 0 | 0 | 0 | 0 |
| Funded from revenue | £7.149 million | £7.335 million | £10.258 million | £10.581 million | £12.201 million |
| Funded from reserves | £1.342 million | £1.633 million | 0 | 0 | 0 |
| Total | £35.943 million | £24.003 million | £31.863 million | £32.584 million | £33.590 million |
| Capital Financing Requirement (CFR) | 2029/2030 Estimate | 2030/2031 Estimate | 2031/2032 Estimate | 2032/2033 Estimate | 2033/2034 Estimate |
|---|---|---|---|---|---|
| General services | £569.677 million | £560.540 million | £550.119 million | £538.660 million | £525.899 million |
| HRA | £358.588 million | £365.279 million | £378.260 million | £390.234 million | £401.467 million |
| Sub-total | £928.265 million | £925.819 million | £928.379 million | £928.894 million | £927.366 million |
| Less PPP/NPD long-term liability | £(56.667) million | £(50.841) million | £(44.793) million | £(38.127) million | £(29.984) million |
| Sub- total | £871.598 million | £874.978million | £883.586 million | £890.767 million | £897.382 million |
| Movement in CFR general services | £(0.974) million | £(3.311) million | £(4.373) million | £(4.793) million | £(4.618) million |
| Movement in CFR HRA | £15.166 million | £6.691 million | £12.981 million | £11.974 million | £11.233 million |
| Annual change | £14.192 million | £3.380 million | £8.608 million | £7.181 million | £6.615 million |
| Proportion of financing costs to net revenue stream | 2029/2030 Estimate | 2030/2031 Estimate | 2031/2032 Estimate | 2032/2033 Estimate | 2033/2034 Estimate |
|---|---|---|---|---|---|
| General services | 5.9% | 6.1% | 6.2% | 6.3% | 6.3% |
| HRA | 33.8% | 34.9% | 33.9% | 34.6% | 33.9% |
| Current portfolio position (excluding PPP/NPD) | 2029/2030 Estimate | 2030/2031 Estimate | 2031/2032 Estimate | 2032/2033 Estimate | 2033/2034 Estimate |
|---|---|---|---|---|---|
| Gross debt at 31 March | £828.294 million | £831.674 million | £840.282 million | £847.463 million | £854.078 million |
| CFR | £871.598 million | £874.978 million | £883.586 million | £890.767 million | £897.382 million |
| (Under)/Over borrowed position | £(43.304) million | £(43.304) million | £(43.304) million | £(43.304) million | £(43.304) million |
| Current portfolio position | 2029 to 2030 Estimate | 2030 to 2031 Estimate | 2031 to 2032 Estimate | 2032 to 2033 Estimate | 2033 to 2034 Estimate |
|---|---|---|---|---|---|
| Investments at 31 March | £30.000 million | £30.000 million | £30.000 million | £30.000 million | £30.000 million |
| Net debt at 31 March | £798.294 million | £801.674 million | £810.282 million | £817.463 million | £824.078 million |
| Operational boundary | 2029 to 2030 Estimate | 2030 to 2031 Estimate | 2031 to 2032 Estimate | 2032 to 2033 Estimate | 2033 to 2034 Estimate |
|---|---|---|---|---|---|
| Anticipated borrowing | £882.654 million | £888.881 million | £896.775 million | £905.781 million | £912.508 million |
| PPP/NPD long-term liability | £56.667 million | £50.841 million | £44.793 million | £38.127 million | £29.984 million |
| Operational boundary | £939.321 million | £939.722 million | £941.568 million | £943.908 million | £942.492 million |
| Authorised limit | 2029 to 2030 Estimate | 2030 to 2031 Estimate | 2031 to 2032 Estimate | 2032 to 2033 Estimate | 2033 to 2034 Estimate |
|---|---|---|---|---|---|
| Operational boundary + 10% | £970.919 million | £977.769 million | £986.453 million | £996.359 million | £1,003.759 million |
| PPP/NPD long-term liability | £56.667 million | £50.841 million | £44.793 million | £38.127 million | £29.984 million |
| Authorised limit | £1,027.586 million | £1,028.610 million | £1,031.246 million | £1,034.486 million | £1,033.743 million |
Appendix 2: Treasury risk register
Appendix 3: Permitted investments, risks and mitigating controls
Appendix 4: Policy on repayment of loans fund advances
Policy on Repayment of Loans Fund Advances
The purpose of the Loans Fund is to record advances from the loan fund for expenditure incurred, or loans made to third parties, which a local authority has determined are to be financed from borrowing as set out in Regulation 2 of The Local Authority (Capital Finance and Accounting) (Scotland) Regulations 2016 [“the Regulations”]. The Council is also statutorily required to repay Loans Fund advances and to prudently determine the periods over which it will repay Loans Fund advances and the amount of repayments in any financial year.
Loans Fund advances comprise several items and the estimated opening balances for 2026/2027, where applicable for North Ayrshire Council, are:
- capital expenditure (£585.697 million);
- grants to third parties and expenditure on third party assets which would be classified as capital expenditure by a local authority (£0 million);
- loans to third parties (£0 million); and
- expenditure for which a borrowing consent has been issued by the Scottish Government (£0 million).
Prudent repayment of Loans Fund advances
The loans fund advance is effectively the repayment of the ‘principal’ linked to the expenditure classified above which is unfinanced and is required to be funded from borrowing. Repayment of loans fund advances are required to be made in line with Scottish Government statutory guidance on Loans Fund Accounting, most recently issued in 2024. The Council’s annual accounts require to include a disclosure of details of Loans Fund transactions. The HRA Loans Fund advances and associated annual repayments are identified separately from that of the General Fund.
The broad aim of prudent repayment is to ensure that the Council’s unfinanced capital expenditure is repaid over the period of years in which that expenditure is expected to provide a benefit and that each year’s repayment amount is reasonably commensurate with the period and pattern of the benefits. Where a loans fund advance is made for an asset, that period will be the asset’s useful life. Where an asset life cannot reasonably be established, the repayment period will not exceed 50 years.
The statutory guidance requires the Council to approve a policy on Loans Fund repayments each year and recommends a number of options for calculating prudent repayments. North Ayrshire Council’s policy is as follows:
For the majority of projects undertaken by the Council the policy is to use the asset life method to repay loans fund advances on an annuity basis, which is similar to the repayment of a mortgage where principal payments are lower at the start of the mortgage and build up to deliver full repayment over the term of the mortgage. As well as annuity, the asset life method has the option of equal instalments.
The Council will continue to consider the most appropriate repayment method which aligns to the benefits of the assets and ensures a prudent repayment.
In addition, there are some projects where income streams are attached to the project which can be reasonably associated with the borrowing which will be undertaken. In these circumstances it may be more appropriate for the advances to be repaid on a profile which matches this income. For these unique projects, loans fund advances may be profiled for repayment to match the income and not on the annuity basis.
These options comply with the statutory guidance and the Council will continue to consider all options available to it.
The repayment of Loans Fund advances will therefore be equal to the annual amount determined in accordance with the Local Authority (Capital Finance and Accounting) (Scotland) Regulations 2016.
The above regulations state that Council’s may vary the period and/or amount of the repayments if they consider it prudent to do so. As a result, officers continue to review existing loans fund advances for opportunities to ensure the most prudent repayment method is being used.
Estimates of prudent Loans Fund repayment
The council's latest estimates of its Loan Fund account information are as follows:
| Year | Opening Balance | Advances to GF | Advances to HRA | Repayment by GF | Repayment by HRA | Closing Balance |
|---|---|---|---|---|---|---|
| 2024/2025 actual | £436.885 million | £65.444 million | £18.976 million | -£1.500 million | -£6.138 million | £513.670 million |
| 2025/2026 | £513.670 million | £56.990 million | £24.571 million | -£2.578 million | -£6.957 million | £585.697 million |
| 2026/2027 to 2030/2031 | £585.697 million | £155.146 million | £185.348 million | -£16.186 million | -£35.103 million | £874.901 million |
| 2031/2032 to 2035/2036 | £874.901 million | £0.551 million | £106.943 million | -£21.965 million | -£50.351 million | £910.079 million |
| 2036/2037 to 2040/2041 | £910.079 million | £0.000 million | £154.256 million | -£41.011 million | -£65.130 million | £958.195 million |
| 2041/2042 to 2045/2046 | £958.195 million | £0.000 million | £47.491 million | -£69.359 million | -£75.617 million | £860.710 million |
| 2046/2047 to 2050/2051 | £860.710 million | £0.000 million | £0.000 million | -£90.672 million | -£80.919 million | £689.119 million |
| 2051/2052 to 2055/2056 | £689.119 million | £0.000 million | £0.000 million | -£106.544 million | -£73.286 million | £509.290 million |
| 2056/2057 to 2060/2061 | £509.290 million | £0.000 million | £0.000 million | -£60.310 million | -£73.848 million | £375.132 million |
| 2061/2062 to 2065/2066 | £375.132 million | £0.000 million | £0.000 million | -£49.667 million | -£77.424 million | £248.042 million |
| 2066/2067 to 2070/2071 | £248.042 million | £0.000 million | £0.000 million | -£34.678 million | -£71.841 million | £141.522 million |
| 2071/2072 and later | £141.522 million | £0.000 million | £0.000 million | -£36.047 million | -£105.475 million | £0.000 million |
Policy on apportioning interest to the HRA
Interest and expenses on all new borrowing is allocated to the HRA based on the share of total borrowing taken each year.
Credit arrangements Loans
Loans Fund advances are not made for credit arrangements such as leases and service concession (PFI/PPP) arrangements, but a statutory charge to revenue similar to a Loans Fund repayment is made to repay the associated debt. Except where flexible arrangements have previously been approved, the charge will be equal to the contractual unitary payment due for the financial year after deducting (a) those amounts which have been already charged to revenue such as interest and (b) actual or prepaid lifecycle replacement costs.
Appendix 5: Economic background - Arlingclose's view January 2026
Economic outlook
The most significant impacts on the Authority’s treasury management strategy for 2026/27 are expected to include: the influence of the government’s 2025 Autumn Budget, lower short-term interest rates alongside higher medium- and longer-term rates, slower economic growth, together with ongoing uncertainties around the global economy, stock market sentiment, and geopolitical issues.
The Bank of England’s Monetary Policy Committee (MPC) cut Bank Rate to 3.75% in December 2025, as expected. The vote to cut was 5-4, with the minority instead favouring holding rates at 4.0%. Those members wanting a cut judged that disinflation was established while those preferring to hold Bank Rate argued that inflation risks remained sufficiently material to leave rates untouched at this stage.
Figures from the Office for National Statistics showed that the UK economy expanded by 0.1% in the third quarter of the calendar year, this was unrevised from the initial estimate. The most recent Monetary Policy Report (November) projected modest economic growth, with GDP expected to rise by 0.2% in the final calendar quarter of 2025. Annual growth is forecast to ease from 1.4% before improving again later, reflecting the delayed effects of lower interest rates, looser monetary conditions, stronger global activity, and higher consumer spending. The view of modest economic growth going forward was echoed by the Office for Budget Responsibility in its Economic and fiscal outlook published in line with the Autumn Statement which revised down its estimate of annual real GDP to around 1.5% on average between 2025 and 2030.
CPI inflation was 3.2% in November 2025, down from 3.6% in the previous month and below the 3.5% expected. Core CPI eased to 3.2% from 3.4%, contrary to forecasts of remaining at 3.6%. Looking forward, the MPC continues to expect inflation to fall, to around 3% in calendar Q1 2026, before steadily returning to the 2% target by late 2026 or early 2027.
The labour market continues to ease with rising unemployment, falling vacancies and flat inactivity. In the three months to October 2025, the unemployment rate increased to 5.1%, higher than the level previously expected by the BoE, while the employment rate slipped to 74.9%. Pay growth for the same period eased modestly, with total earnings (including bonuses) growth at 4.7% and while regular pay was 4.6%.
The US Federal Reserve also continued to cut rates, including reducing the target range for the Federal Funds Rate by 0.25% at its December 2025 meeting, to 3.50%-3.75%, in line with expectations. The minutes of the meeting noted that most Fed policymakers judged that further rate cuts would be likely in 2026 if inflation continues to ease, however they were still divided in their assessment of the risks between inflation and unemployment.
The European Central Bank (ECB) kept its key interest rates unchanged in December for a fourth consecutive meeting, maintaining the deposit rate at 2.0% and the main refinancing rate at 2.15%. The ECB maintained that future policy decisions will remain data-dependent, that inflation is close to its 2% target and that the euro area economy continues to expand despite a challenging global environment, including heightened geopolitical risks and trade tensions.
Credit outlook
Credit Default Swap (CDS) prices, which spiked in April 2025 following President Trump’s ‘Liberation Day’ tariff announcements, have since trended lower, returning to levels broadly consistent with their 2024 averages. Although CDS prices rose modestly in October, the overall credit outlook remains stable, and credit conditions are expected to remain close to the range seen over the past two years.
While lower interest rates may weigh on banks’ profitability, strong capital positions, easing inflation, steady economic growth, low unemployment, and reduced borrowing costs for households and businesses all support a favourable outlook for the creditworthiness of institutions on (the authority’s treasury management advisor) Arlingclose’s counterparty list. Arlingclose’s advice on approved counterparties and recommended investment durations is kept under continuous review and will continue to reflect prevailing economic and credit conditions.